Want to be in the loop?
subscribe to
our notification
Business News
SOCIO- ECONOMIC STATISTICS IN THE FIRST HALF OF 2013 - ECONOMIC GROWTH
Generally, the country’s economic growth in recent years has been mostly owing to the service’s contribution; the sectors of agriculture-forestry-fishery and industry-construction have met many difficulties in production and business. With the service sector in the first six months of the year, except for real estate business that rose 1.8percent, other activities had great proportions and considerable growth rates: whole and retail sales 5.33percent; board and lodging service 8.78percent; finance, banking and assurance 6.4percent; education and training 8.02percent; transport and warehouse 5.59percent and others 7 – 8percent. However, the manufacturing had a rather change since the second quarter with value added in 2nd Q. contributing 2.3 points percent higher than that in 1st Q. (Respectively, in last year it was 0.4 point percent higher only).
+ Gross Domestic Products, 1st six months of 2013
Agriculture, forestry and fishery
The production value of this sector in the first six months of the year at 2010 comparative prices was estimated to grow 2.4percent from last year’ same period, of which agriculture obtained a growth rate of 2.2percent; forestry 5.7percent and fishery 2.5percent. In agriculture production, decrease in animal husbandry influenced on the development of the whole sector. Production value of animal husbandry rose 0.9percent only, much lower than 6.5% growth rate in last year’ same period. Production value of aquaculture grew only1.8percent, while it was 7.2percent in last year’ same period.
Agriculture
The country’s area for cultivation of winter-spring rice in this year reached 3,139,900 ha, up 15,700 ha from 2012’ same crop; the productivity reached 6,450 kg/ha, down 40 kg/ha compared to that in the same crop last year; the yield hit 20.3 million tons, down 29,400 tons. The output of winter-spring rice in the North reached 7.2 million tons, down 45,100 tons, in the South estimated 13.1 million tons; up 15,700 tons (the main point of rice- Mekong delta reached 10.8 million tons, up 27,000 tons). The output of other crops was as follows: maize reached 2.5 million tons, up 4.6%; soybean 90,500 tons, up10.9%; peanut 377,100 tons, up 5.1%; vegetables 8 millions of tons, up 1.0% from last year’ same crops.
Harvested output of some perennial and fruit plants rose considerably against that in the same period last year due to increase in cultivated area: tea reached 407,600 tons, up 2.3%; rubber 309,000 tons, up 7.9%; pepper 109,000 tons, up 4.8%; mango up 11.2%; orange, tangerine up 9.7%... only cashew nut reached 278,100 tons, down 11.4%; coconut 653,500 tons, down 3%, mainly as selling prices were low, a part of cultivated area was used for planting other more efficient trees.
As of 15/6/2013, the country had 2.6 millions of buffalos, down 2.5%; 5.1 millions of oxen, down 3.2%; 174,700 cows, up 10.3%; 26.5 millions of pigs, down 0.5%; 304.5 millions of fowls, down 2% compared to the figures in last year’ same period; live-weight output of buffalos declined 0.6percent; oxen rose 3.5percent; pigs declined 0.1percent; poultry declined 1.8percent; output of eggs rose 5.8percent; milk rose 9.2percent.
+ Production value of agriculture, forestry & fishery Six months of 2013 At 2010 comparative prices
+ Winter-spring crop production in 2013
+ Cultivated area, productivity & yield of winter-spring rice in 2013 By province
Forestry
In the first six months of the year, newly concentrated planted area was estimated to reach 66,100 ha, rose 17.6% from the same period last year; decentralized planted trees reached 111.3 million, up 2.4%; wood production 2,410,600 m3, up 7.2%. Damaged area over the country was 1,355 ha, declined 10.7percent from last year’ same period, of which burnt area was 845 ha, down 2.3%; destroyed area was 510 ha, down 21.8%.
Fishery
Six months’ fishing production reached estimated 2,737,000 tons, up 1.5% from the figures in 2012’ same period, of which there were 2,109, 000 tons of fish, up 0.8%, 262, 000 tons of shrimp, up 2.8%.
Aquaculture are reached estimated 920,000 ha, rose 0.6percent from last year’ same period. Six months’ aquaculture production reached estimated 1,425,000 tons, declined 0.4 percent from last year’ same period, of which there were 1,121,000 tons of fish, down 1.5%; 181,000 tons of shrimp, up 3%. The decrease in aquaculture production was mainly due to problem in consuming the shark catfish products. Six months’ shark catfish production hit only 560,000 tons, declined 3percent from last year’ same period. Shrimp hatching showed its more stabilized development and people tended to gradually shift to raise the White leg shrimp since it was seldom infected with disease it was more efficient therefore. The area for raising the White leg shrimp in the first six months reached estimated 25,000 ha raised 4.8percent from the same period in 2012; the output reached 57,000 tons, up12%. Catching production reached estimated 1,312,000 tons, grew 3.6 percent from the same period in 2012, of which sea catching reached 1,226,000 tons, up 3.8%.
+ Fishing production, six months of 2013
Industry
Six months’ Industrial Production Index (IPI) was estimated to grow 5.2 percent from last year’ same period (IPI in 2nd Q. was up 1.5 points percent from 1st Q., while in 2012 2nd Q.’s IPI was up only 0.4 point percent from 1st Q.). Of the general growth rate of 5.2%, mining and quarrying contributed 0.4 point percent; manufacturing 4.1 points percent; power production and supply 0.6 point percent and water supply and wastes treatment 0.1 point percent.
IPI of the mining and quarrying in the first six months grew 1.9percent, which was much lower than the 4.2% growth in last year’ same period, it was mainly due to decrease in coal and crude oil production. IPI of the manufacturing grew 5.7percent (it rose 5.9percent in the same period last year), this was the industry accounted the largest proportion in the whole industrial sector, although it did not reach the same growth rate as it did in last year’ same period but the pace in 2nd Q. was up 2.3 points percent from that in 1st Q. (in 2012 the pace in 2nd Q. was down 1.0 point percent from that in 1st Q.). IPI of the power production and supply grew 8.7percent, much lower than the 14.7% growth rate in last year’ same period.
The consumption index for the manufacturing in the first five months of the year rose 7.51percent from last year’ same period. The stock index as of 01/6/2013 for the whole manufacturing sector rose 9.7percent. The stock index in May this year was 71%; it was 75.4% in the first five months of the year.
Employment index (EI) for industrial enterprises in June rose 0.8% from May. Compared to the same period last year, June’s employment index raised 2.8percent, of which EI of the state owned businesses sector increased by 0.1%; the non-state sector decreased by 1.5 and the FDI sector rose 6.6percent. June’s EI in the mining and quarrying sector decreased by 1.5%; in the manufacturing sector increased by 3.2%; in the power generation and supply by 2.3% and in the water supply and waste treatment by 3.3%.
+ Industrial production index
+ Main industrial products
Construction
Construction production value at current prices was estimated to reach 325.3 trillion of dong, of which the state sector hit 38.3 trillions of dong, accounted for 11.8%; the non-state sector 277.6 trillions of dong, accounted for 85.3% and the FDI sector 9.4 trillions of dong, accounted for 2.9%. Construction production value in the first six months of the year at 2010 comparison prices was estimated to grow 5.2 per cent from last year’ same period, of which the state sector rose 5.1percent; the non-state sector 5.6percent; the FDI sector declined 6.1percent.
Service
As estimated, total retailed sales of consumer goods and services in the first six months rose 11.9 percent from the same period in 2012, if the factor of inflation were excluded, it would be 4.9%, although it was much lower than the 6.7% growth in 2012’ same period but in this year the growth rate in 2nd Q. was 5.1%, higher than that of 4.5% in the previous quarter.
+ Total retail sales of consumer goods and services
Six months’ passenger carriage was estimated to grow 3.9 percent by passengers carried and 3.6 percent by passengers-kilometers carried from the same period in 2012, of which land transport rose 4percent and 3.9percent; airway 1.8percent and 3.6percent; railway declined 0.2percent and 2.1percent; seaway rose 4.9percent and 3.7percent respectively.
Six months’ cargo carriage was estimated to rise 2.8 percent by tons carried and to reduce 3.5 percent by tons-kilometers carried from last year’ same period, of which the domestic transport rose 3.2 percent by tons carried and 2.5 percent by tons-kilometers carried; the overseas transport declined 6.7percent and 8.1percent respectively. Similarly, land transport rose 3.6percent and 4.6percent; river 2.9percent and 5.1percent; sea declined 9.8percent and 8.2percent; rail was down 4.1percent and 5.3percent.
+ Carriage of passengers & cargo
International visitors to Viet Nam
International arrivals to Viet Nam in the first six months of the year were at an estimation of 3,540,400, rose 2.6 percent from last year’ same period (arrivals in the first quarter decreased by 6.2%, but in the second quarter increased by 13.5%), of which arrivals coming for tourist purposes were 2,169,400, up 4.9%; for business purposes 592,500, up 1.8%; for meeting relatives 590,000, down 1%.
+ International visitors to Vietnam
STABILISE MACROECONOMY, CURB INFLATION
Investment & development
Six months’ realized social investment capital at current prices was at an estimation of 448.6 trillions of dong, rose 5.9 percent from the same period last year and equaled 29.6% of GDP. Of which state capital reached 166.1 trillions of dong, accounted for 37% of total capital and up 3.5%; the non-state sector 168.2 trillions of dong, accounted for 37.5% and up 9.9%; the FDI sector 114.3 trillions of dong, accounted for 25.5% and up 3.9% from last year’ same period. Of the state sector’s realized investment, capital from the state budget in six months was estimated to reach 88.5 trillion of dong, equaling 44% of the yearly estimate and down 1.9% compared to that in the same period in 2012.
Attraction of FDI from the beginning of the year to 20/6/2013 reached USD 10,472.9 million, equaling 115.9% of that in 2012’ same period. Of which, registered capital of 554 newly licensed projects reached USD 5,812.0 million, equaling 89.6% of registered projects and 103.7% of registered capital in 2012’ same period; additional registered capital of 217 times of projects licensed from previous years was USD 4,660.9 million. Estimated realized FDI in 6 months of this year reached USD 5.7 billion, equaling 105.6% of that in last year’ same period. FDI in the first six months of this year mainly focused on the manufacturing with 88.9% of total registered capital; the real estate business accounted for 4%.
Among 41 countries and territorial regions having newly licensed FDI projects in Viet Nam in the first six months of the year, Singapore continued to be the biggest investor with the fund accounting for 40% of total newly licensed registered capital; following were Russian Federation with FDI capital accounting for 17.5%; Japan with FDI capital accounting for 16.5%; Republic of Korea with FDI capital accounting for 8%; Thailand with FDI capital accounting for 5.3%.
+ Realized development investments under State Budget
+ Licensed FDI projects, 01/01- 20/6/2013
Government revenues and expenditures
Total Government revenues from the beginning of the year to 15/6/2013 were at an estimation of VND 324.4 trillion, equaling 39.8% of the yearly estimate, of which domestic revenues reached VND 217.2 trillion, equaling 39.8%; from crude oil VND 50.3 trillion, equaling 50.8%; from export-import balance VND 54.4 trillion, equaling 32.7%. Of the domestic revenues, collecting from state enterprises was VND 64.4 trillion, equaling 36.9% of the yearly estimate; from FDI enterprises (excluding crude oil) VND 49.1 trillion, equaling 45.7%; from non-state industrial, commercial and service taxes VND 47.4 trillion, equaling 39.3%; from individual income tax VND 25.3 trillion, equaling 46.2%.
Total Government expenditures from the beginning of the year to 15/6/2013 were at an estimation of VND 409.1 trillion, equaling 41.8% of the yearly estimate, of which spending for investment development reached VND 74.3 trillion, equaling 42.4% (spending for capital construction only was VND 72 trillion, equaling 42.3%); spending for economic and social development, national defense and security (including spending for salary reform) was at an estimation of VND 287.1 trillion, equaling 42.6%; paying debts and aids was 47.8 trillion, equaling 45.5%.
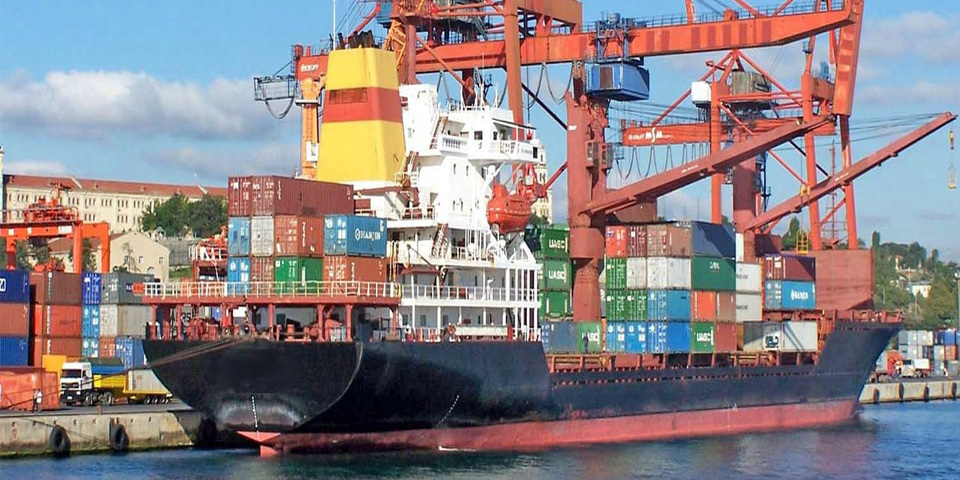
Exports-Imports
Exports
As estimated, six months’ export turnovers reached USD 62 billion, grew 16.1 percent from last year ‘same period, of which the domestic economic sector reached USD 20.9 billion, up 2.2%; the FDI sector (including crude oil) USD 41.1 billion, accounted for 66.3% of the total. If the price factor were excluded, export turnovers in the first six months of the year would be at an estimation of USD 64.8 billion rose 21.2percent.
Export turnovers in the first six months of the year grew highly mainly in the FDI sector with exported items accounting for large proportion in total exported turnovers for corresponding items such as: electronics, computers and accessories; telephones of all kinds and supplies; footgear; textile products. The increase in export turnovers of this sector contributed 15.3 points percent to the general growth rate, while the domestic economic sector contributed only 0.8 point percent to the general growth.
+ Exports
Imports
As estimated, six months’ import turnovers reached USD 63.4 billion, rose17.4 percent from last year ‘same period (it raised 15.4percent in 1st Q. and 19.2percent in 2nd Q.). Of which the domestic economic sector reached USD 27.7 billion, up 6.3%; and the FDI sector gained USD 35.7 billion, up 27.8%. Like exportation, import turnovers of the FDI sector mainly included items accounting for large proportion in total imported turnovers for corresponding imported items such as: electronics, computers and accessories; telephones of all kinds and supplies; footgear; fabrics; textile raw materials. If the price factor were excluded, six months’ import turnovers would hit USD 65.1 billion, rose 20.5percent from last year’ same period.
Six months’'trade deficit was at an estimation of USD 1.4 billion, equaling 2.3% of export turnovers, of which trade deficit was USD 233 millions in 1st Q. and USD 1.6 billion in 2nd quarter.
+ Imports
Price indexes
Consumer price indexes (CPI)
June’s CPI raised 0.05percent from May. Among groups of goods and services, garments, hats, footgear grew 0.42percent; culture, entertainment, tourist 0.4percent; family appliances 0.33percent; drinks and tobacco 0.32percent; medicines and health care service 0.09percent; education 0.03percent; housing and construction material 0.02percent. Other groups with decreased CPI included: postal and communicational service 0.13percent; transport 0.09percent; catering and related service 0.08percent (grain food 0.62percent; foodstuff 0.03percent).
June’s CPI was up 2.4% from December 2012 and up 6.69% from last year’ same period. Average CPI in the first six months of the year grew 6.73percent compared to that in 2012’ same period.
Producer price indexes (PPI) and Export-Import Price Indexes (EIPI)
PPI for agricultural, forest and fishing products in six months declined 2.51percent from last year’ same period; PPI for industrial products rose 4.18percent; Raw materials price indexes (RMPI) for domestic production grew 2.93percent; Transport and warehouse charge indexes (TWCI) rose 7.63percent.
Export Price Index (EPI) in 1st six months of the year fell by 4.21percent against that in the same period last year; Import Price Index (IPI) fell by 2.56percent.
+ Export price indexes in 2nd Quarter of 2013
+ Producers’ Price Indexes for agricultural, forestry and fishing products 2nd Quarter of 2013
+ Producers’ Price Indexes for industrial products, 2nd Quarter of 2013
+ Price indexes of materials used for production 2nd Quarter of 2013
+ Export price indexes in 2nd Quarter of 2013
+ Import price indexes in 2nd Quarter of 2013
+ Export-Import price indexes and trade exchange rate 2nd Quarter of 2013
+ Transport charge indexes in 2nd Quarter of 2013
SOCIAL ISSUES
Labor and employment
The country’s estimated labor force aged 15 and above as of 01/7/2013 was 53.3 million, up 715,600 against the figures at 01/7/2012 and up 308,000 against the figures at 01/4/2013. The labor force within working age group were 47.2 million persons, increasing by 249,200 persons against the figures as at 01/7/2012; and increasing 98,500 persons against the figures as at 01/4/2013. Working laborers aged 15 and above in 1st six months of the year were 52.2 million, up 0.97% compared to the figures in 2012. Working laborers aged 15 and above in the sector of agriculture, forestry and fishery accounted for 47.4% of the total workforce, unchanged against last year; in the sector of industry and construction 20.7%, down 0.5 point percent; in the sector of service 31.9%, up 0.5 point percent.
Estimated unemployment rate of laborers of working age in six months was 2.28%, of which it was 3.85% for urban area and 1.57% for rural area. Estimated underemployment rate of laborers of working age in six months was 2.95%, of which it was 1.76% for urban area and 3.47% for rural area.
Estimated unemployment rate for youths aged 15-24 in six months was 6.07%, of which it was 11.45% for urban area and 4.41% for rural area. Estimated unemployment rate for adults aged 25 and above in six months was 1.34%, of which it was 2.55% for rural area and 0.8% for rural area. In urban are, unemployment rate of youths was 4.5 times bigger than that of adults.
People’s life and social security
Generally, the country in the first six months of the year had 323,200 times of hunger families, fell by 10% against the figures in 2012’ same period, which was in equivalent to 1,351,000 times of hunger persons, decreased by10.4%. According to preliminary data from 2012 People’s Living Standard Survey, the rate of poverty households over the country in 2012 was 11.1%, reduced 1.5 point percent from 2011.
Education
According to preliminary reports, 941,000 candidates over the country registered for sitting high school finals in the school year of 2012-2013. Graduated rate was 97.5% (dropped 1.4 points percent against that in the school year of 2011-2012); graduated rate for high school’s continuing education was 78.1% (dropped 7.4 points percent).
As of finishing of June 2013, the country had 61/63 provinces and cities met standard for universal primary education at the right age (of which 04 provinces and cities met standard for universal primary education at the right age of level 2) and 63/63 provinces and cities met standard for universal junior secondary education.
In the school year of 2012-2013, the country had 424 universities and colleges (343 public schools and 81 non-public ones) and 295 professional secondary schools (202 public schools and 93 non-public ones). There were 2.2 million of students of universities and colleges and 562,600 students of professional secondary schools.
Epidemic diseases, food poisoning
The country in the first six months of the year had 18,900 cases of hemorrhagic fever (13 died); 33,700 cases of hand, foot, mouth disease (11died); 282 cases of virus encephalitis (9 died); 102 cases of typhoid; 5 cases of meningococcal meningitis (2 died) and 2 cases of A (H5N1) flu; 18 cases of syndrome of dermatitis thick horn foots and hands. More 489 HIV-infected cases were found in June, bringing the number of living HIV infected persons over the country as of 17/6/2013 to 213,200, of which 62,600 turned to AIDS . Persons died of AIDS over the country as of 17/6/2013 were 63,700. Compared to May, persons died of AIDS in June decreased by 22.5% (9 persons).
The country since the beginning of the year had 64 cases of food poisoning, infecting 1,485 persons, of which 15 died.
Traffic accidents
Generally, the country in the first six months of the year had 5,514 cases of traffic accident, killing 4,913 persons and injuring 3,465 others. Compared to the same period last year, cases of traffic accident raised 3.6percent; the death 5.5percent and the injured declined 11.3percent. On average, each day in six months the country had 31 cases of traffic accident, killing 27 persons and injuring 21 others.
Damage by natural calamity
In the first six months of the year, natural calamity made 74 persons died and gone missing, 181 persons injured; nearly1,000 houses collapsed and swept away; over 63,000 houses blown off; over 8,000 ha of rice and nearly 19,000 ha of vegetables flooded and damaged. Total damage by calamity was at an estimation of 1,170 billion of dong. Total supported cash to damaged localities was 2.2 billion of dong.
Environmental and fire protection
In the first six months of the year, functioning authorities discovered 3,500 environment violated cases in 56 provinces and cities, of which 1,700 cases were treated with nearly 362 billion of dong fines. 1,274 serious cases of fire and explosion killed 61 persons and injured 112 others. Damage valued about 519 billion of dong.
GENERAL STATISTICS OFFICE
Related News
MEMBER CORNER / PROMOTIONS
ECONOMIC NEWS RECAP - APRIL 2024
As we enter another month of 2024, it's a fitting time to review Vietnam's key economic developments in the past month. Thus, in our ongoing commitment to help everyone stay informed about Vietnam's economy, we are pleased to present to you the newest edition of our "Economic News Recap" series.
MEMBER CORNER / PROMOTIONS
BE OUR LOYAL GUEST
For just 6,800,000 VND (net)**, members can enjoy an array of exclusive benefits

VIETNAM ECONOMY INVESTMENT
VIETNAM TO STRENGTHEN CARBON CREDIT MANAGEMENT
Prime Minister Pham Minh Chinh has urged ministries to work with relevant agencies to reach deals with international partners to develop a carbon credit market, reduce greenhouse gas (GHG) emissions, allocate emission quotas, and create green financial resources for Vietnam.

PROPERTY / INDUSTRIAL ZONE
BUSINESS CONCERNS APPARENT ON LAND LAW
At a meeting in mid-April, Deputy Prime Minister Tran Hong Ha asked the Ministry of Natural Resources and Environment to continue clarifying issues with different opinions on the scope, subjects, and implementation policies of the law, while speeding up the online processing of administrative procedures related to land.
VIETNAM ECONOMY INVESTMENT
MPI TO AMEND DECREE 35 ON THE IMPLEMENTATION OF PPP REGULATIONS
Deputy Prime Minister Tran Hong Ha has permitted the Ministry of Planning and Investment (MPI) to draft amendments and supplements to Decree No.35/2021/ND-CP, which provide guidance for the implementation of the Law on Public-Private Partnership Investment.
VIETNAM ECONOMY INVESTMENT
PHONE AND COMPONENT EXPORTS HIT $18.4 BILLION IN FIRST FOUR MONTHS
In terms of markets, the United States has become Vietnam's largest customer instead of China (in the first quarter of last year). Specifically, in the first quarter of this year, the US spent more than $3.05 billion importing all types of phones and components from Vietnam, an increase of 30.4 per cent on-year. The Chinese market ranked second with more than $2.5 billion, down 28 per cent on-year.
Events Sponsors